RNamgis
A salmonid disease water monitoring project
2022-05-05

One of my biggest projects of 2022 was to develop a quick and easy-to-use data pipeline for a very data intensive salmonid disease water monitoring project. The number one request from the client: they needed a platform with incredibly fast turnaround times between collecting data in the field and producing clean, professional looking reports to deliver back to the ‘Nam̱gis First Nation. The client was the Pacific Salmon Foundation in partnership with DFO.
The problem: all data exchange boiled down to emailing each other literally hundreds of Excel and csv files. Not ideal when the goal is fast turnaround.
The solution: a custom R package, rnamgis, to automate, validate, and streamline the flow of data and produce clean, professional looking reports.
The data components
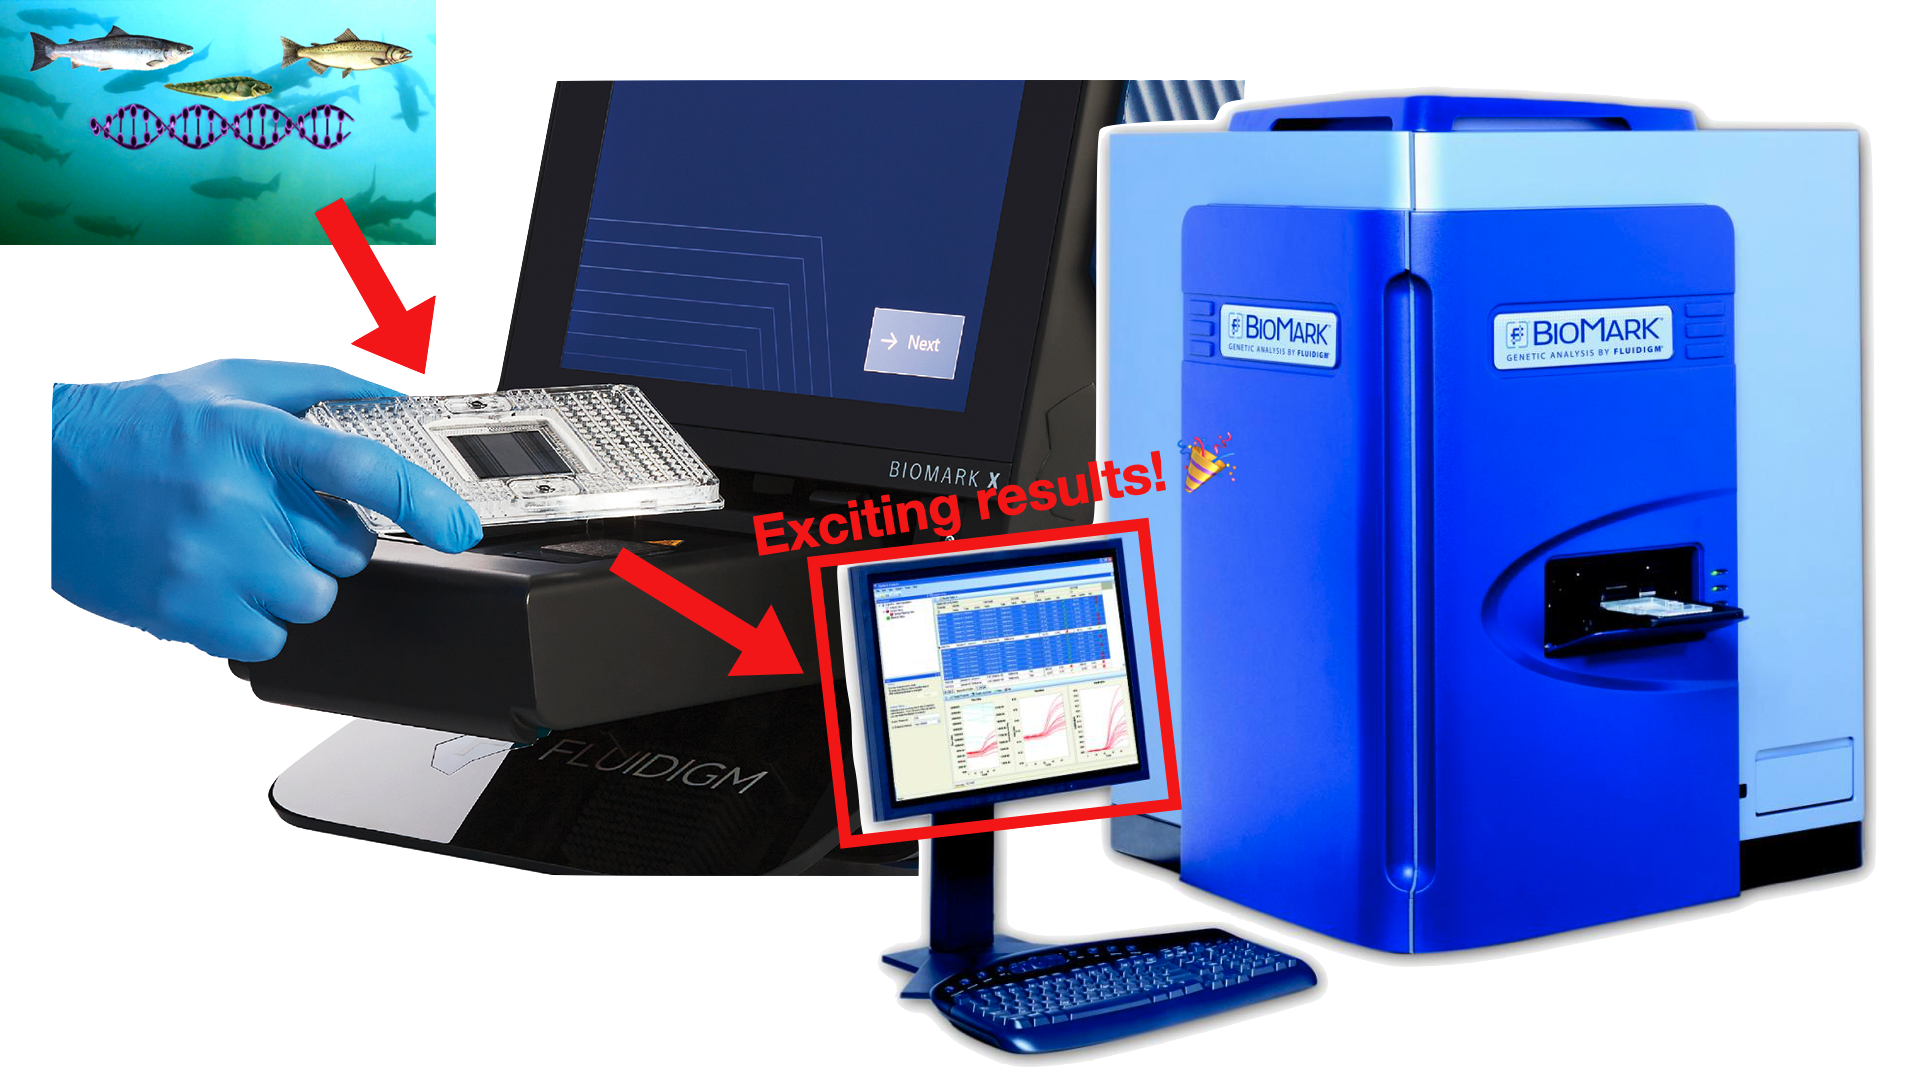
Seawater containing environmental DNA (eDNA) is collected around fish farms. The water samples are then loaded into trays for analysis in the Fluidigm BioMark machine, which outputs high volumes of results.
The goal of the project was to create a near-real time water monitoring system to test for disease prevalence (or absence) around salmon farms within ‘Nam̱gis territory. Field technicians collect environmental DNA (eDNA) water samples that are then sent to the labs at DFO for processing using the Fluidigm BioMark high throughput qPCR system. Processing eDNA samples is an incredibly data intensive task: for every tray of samples processed, the Fluidigm BioMark machine outputs exactly 9216 rows of data, and several of these trays are typically collected per site per week. So, this data pipeline had to be robust enough to handle thousands-to-hundreds of thousands of new records per week, but flexible enough to do so quickly.
In addition to keeping track of the actual reams of results, it was important to find a way to easily store metadata about 1) the field site itself and 2) the actual assays used in the BioMark workflow such that this information could be easily linked back to the results. The field and lab technicians aren’t necessarily trained as data scientists, so the data entry system had to be intuitive and simple. (It’s my job to deal with the data, after all - the technicians have their work cut out for them already!) We settled on a Google Sheets solution. All data entry would be done on a shared Google Drive, and any of us could go in and add or fix data as needed.
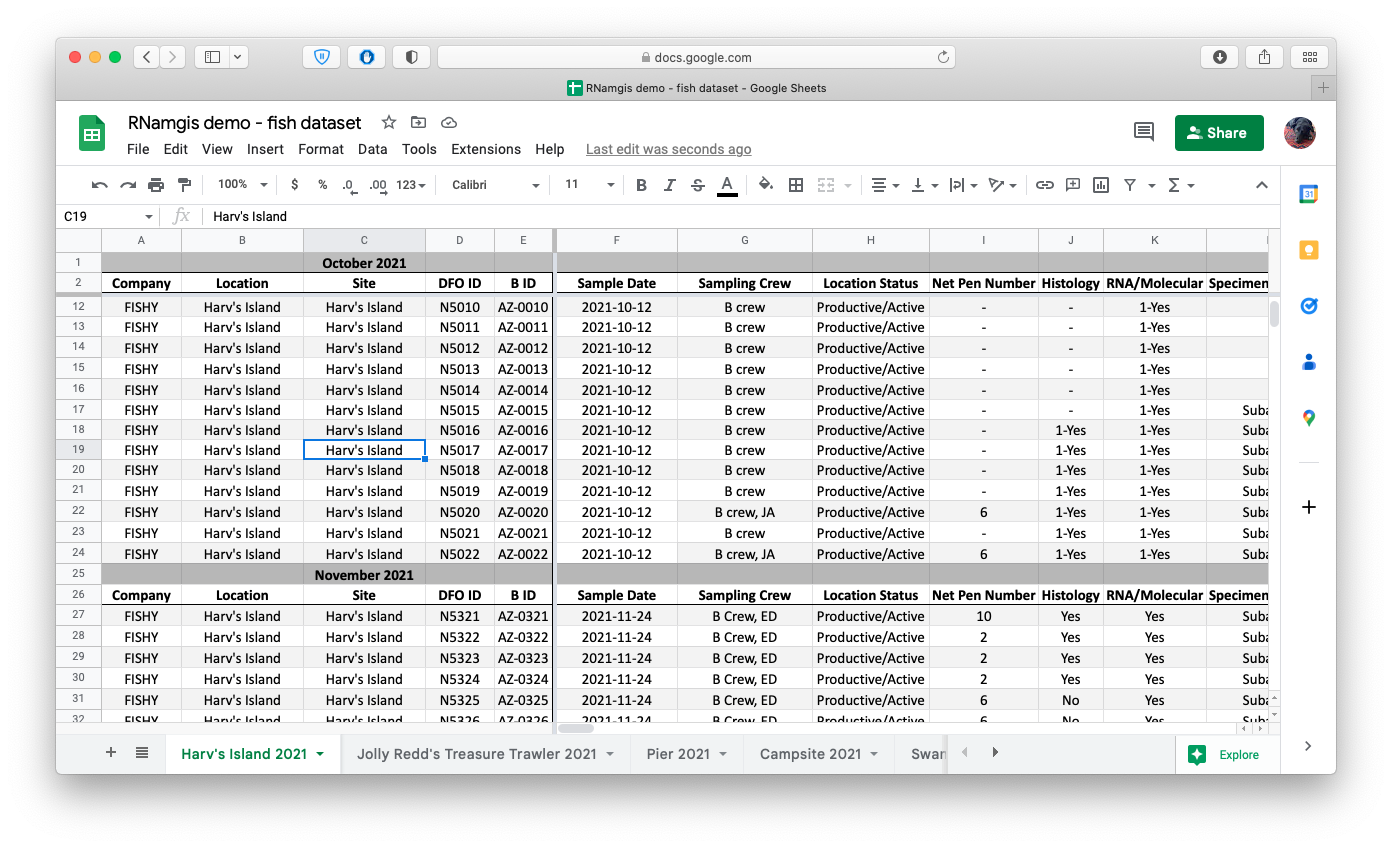
Screenshot of the Google Drive spreadsheet containing example fish data. Naturally the fish are all sampled from Animal Crossing locations. The header/column formats were already in place and used by the data entry team by the time I arrived on the project, and while the format is not very data science-friendly, I opted to write some data formatting functions rather than forcing the entire data team to change their data entry template.
SQL
The data workhorse biologists don’t use enough
Whenever you have reams of data like in this project, with so many discrete components that need to be processed separately but eventually linked back up together, the first thing you should do is whisper to yourself: I need you, SQL. Post haste. Or least that’s what I do now anyways, 2 (3? What year is it again?) years into work-from-home-alone. For any of you data wranglers out there, SQL is your friend and should be your go-to solution to managing complex datasets. In this case, we settled on SQLite for several reasons: 1) it’s serverless, meaning we don’t need to worry about the stringent data security protocols at DFO, where gaining access to a server can be a potentially years-long wait; 2) because it’s serverless, the data lives in a compact little .db file, which can be easily shared with collaborators; and 3) some of us use Macs, so MS Access was out of the question.
Bringing it all together
As the majority of our collaborators primarily use R for data analysis, I built the R package rnamgis to get a handle on the firehose of data being produced. In a nutshell: you enter your metadata on Google Drive, you dump your data files in a folder, and you run a series of rnamgis functions to create and/or update the Namgis SQLite database. Any time you update the database, a backup of the old version is automatically saved in case you’ve made any errors.
Automated reporting
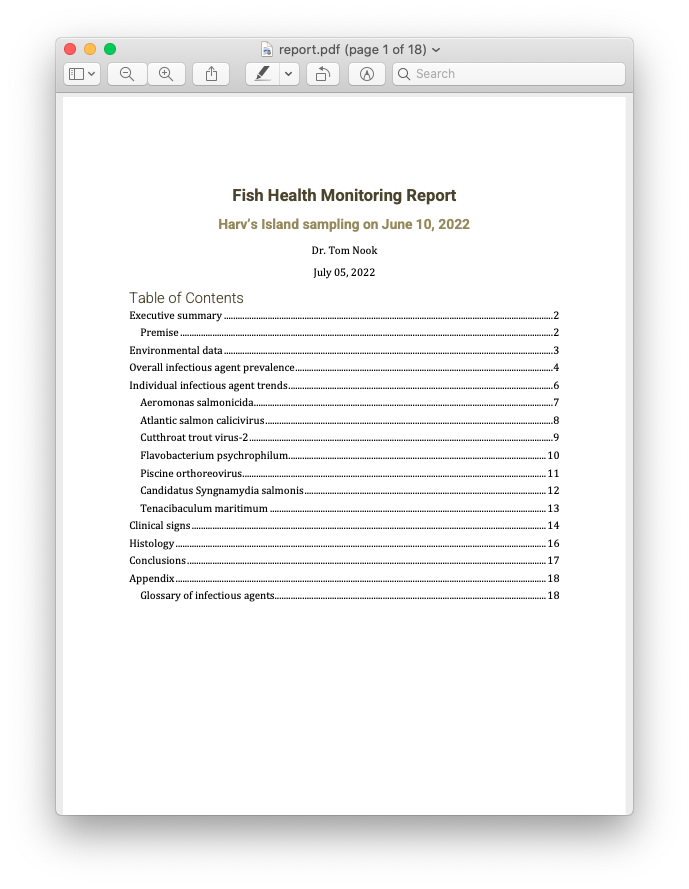
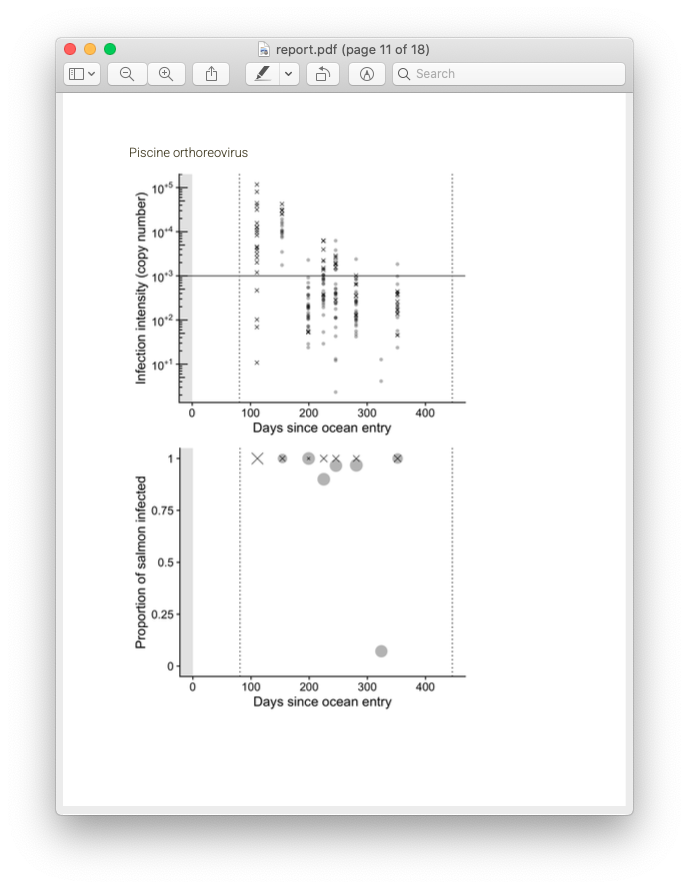
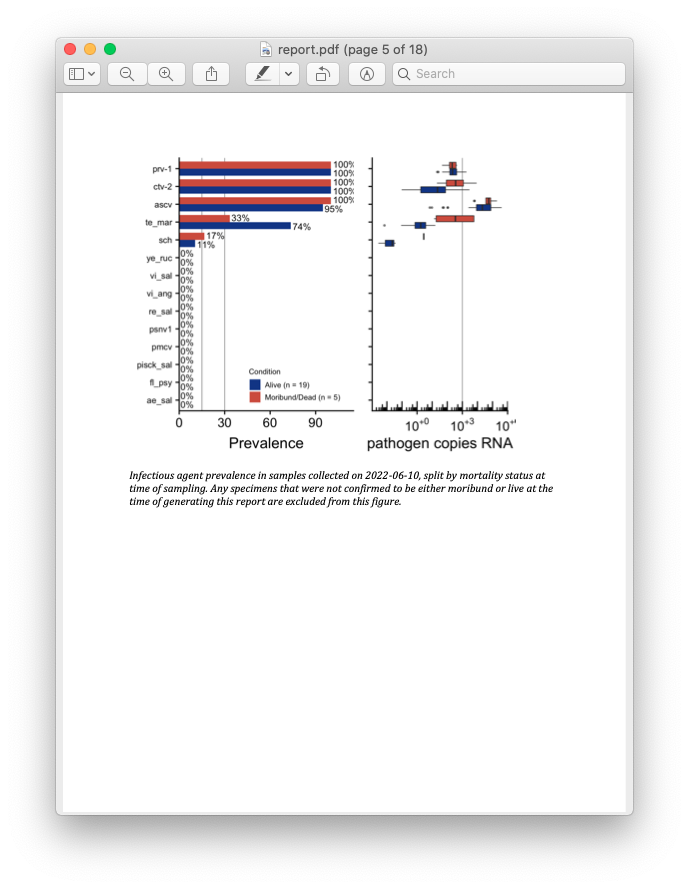
Screenshot of the report produced with the downloaded fish data.
Recall from the beginning of this post that the primary goal of this entire project is for fast turnaround between data collection and results. While it’s great to store your data in a tidy SQLite system, the ultimate goal of data collection is sharing the eventual results! Here is where automated report generation comes in. Previously, a collaborator at PSF was writing up a new Word document (by hand! woe is me) each month with a summary of results. Unfortunately this meant that while the data collection and processing was near-real time, the writing of reports was time consuming. In order to speed this up, I made use of RMarkdown templates. Bundled in with rnamgis is a report template that is automatically populated with data for each farm site, complete with figures showing disease prevalence through time and at that particular week.
I think this project really highlights the real strengths of the R + SQLite power duo: one carefully crafted package can take you from a tangled web of Excel + csv files to a smooth data pipeline complete with automated data reporting. Plus, the client is happy too.