OPPTools
A custom built R package
2022-03-28
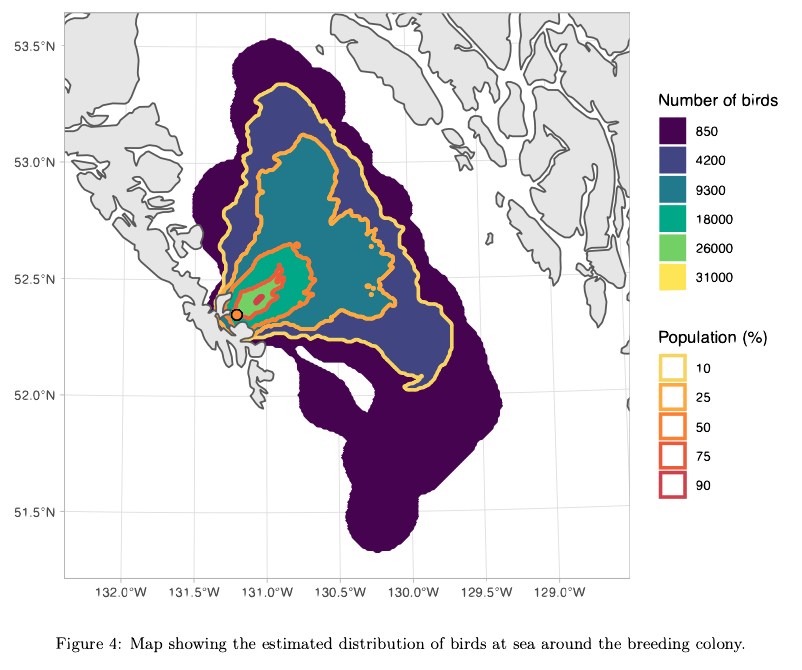
A map generated by the OPPTools R package, showing the number of birds around a colony. The package uses satellite tracks of tagged birds to generate population size and space-use estimates.
In the spring of this year, I was employed for a short casual position contract with Environment and Climate Change Canada (ECCC), which had a backlog of satellite tagged seabird data collected for the Oceans Protections Plan (OPP). The goal of this program was to generate scientifically rigorous yet easy to understand data products for oil spill emergency responders. This meant maps: we needed to show where the seabirds are and how many are there in an easily digestible format. In the case of an oil spill or similar disaster, first responders at OPP would be able to quickly determine if any seabird colonies were at risk and prioritize their cleanup efforts at certain locations.
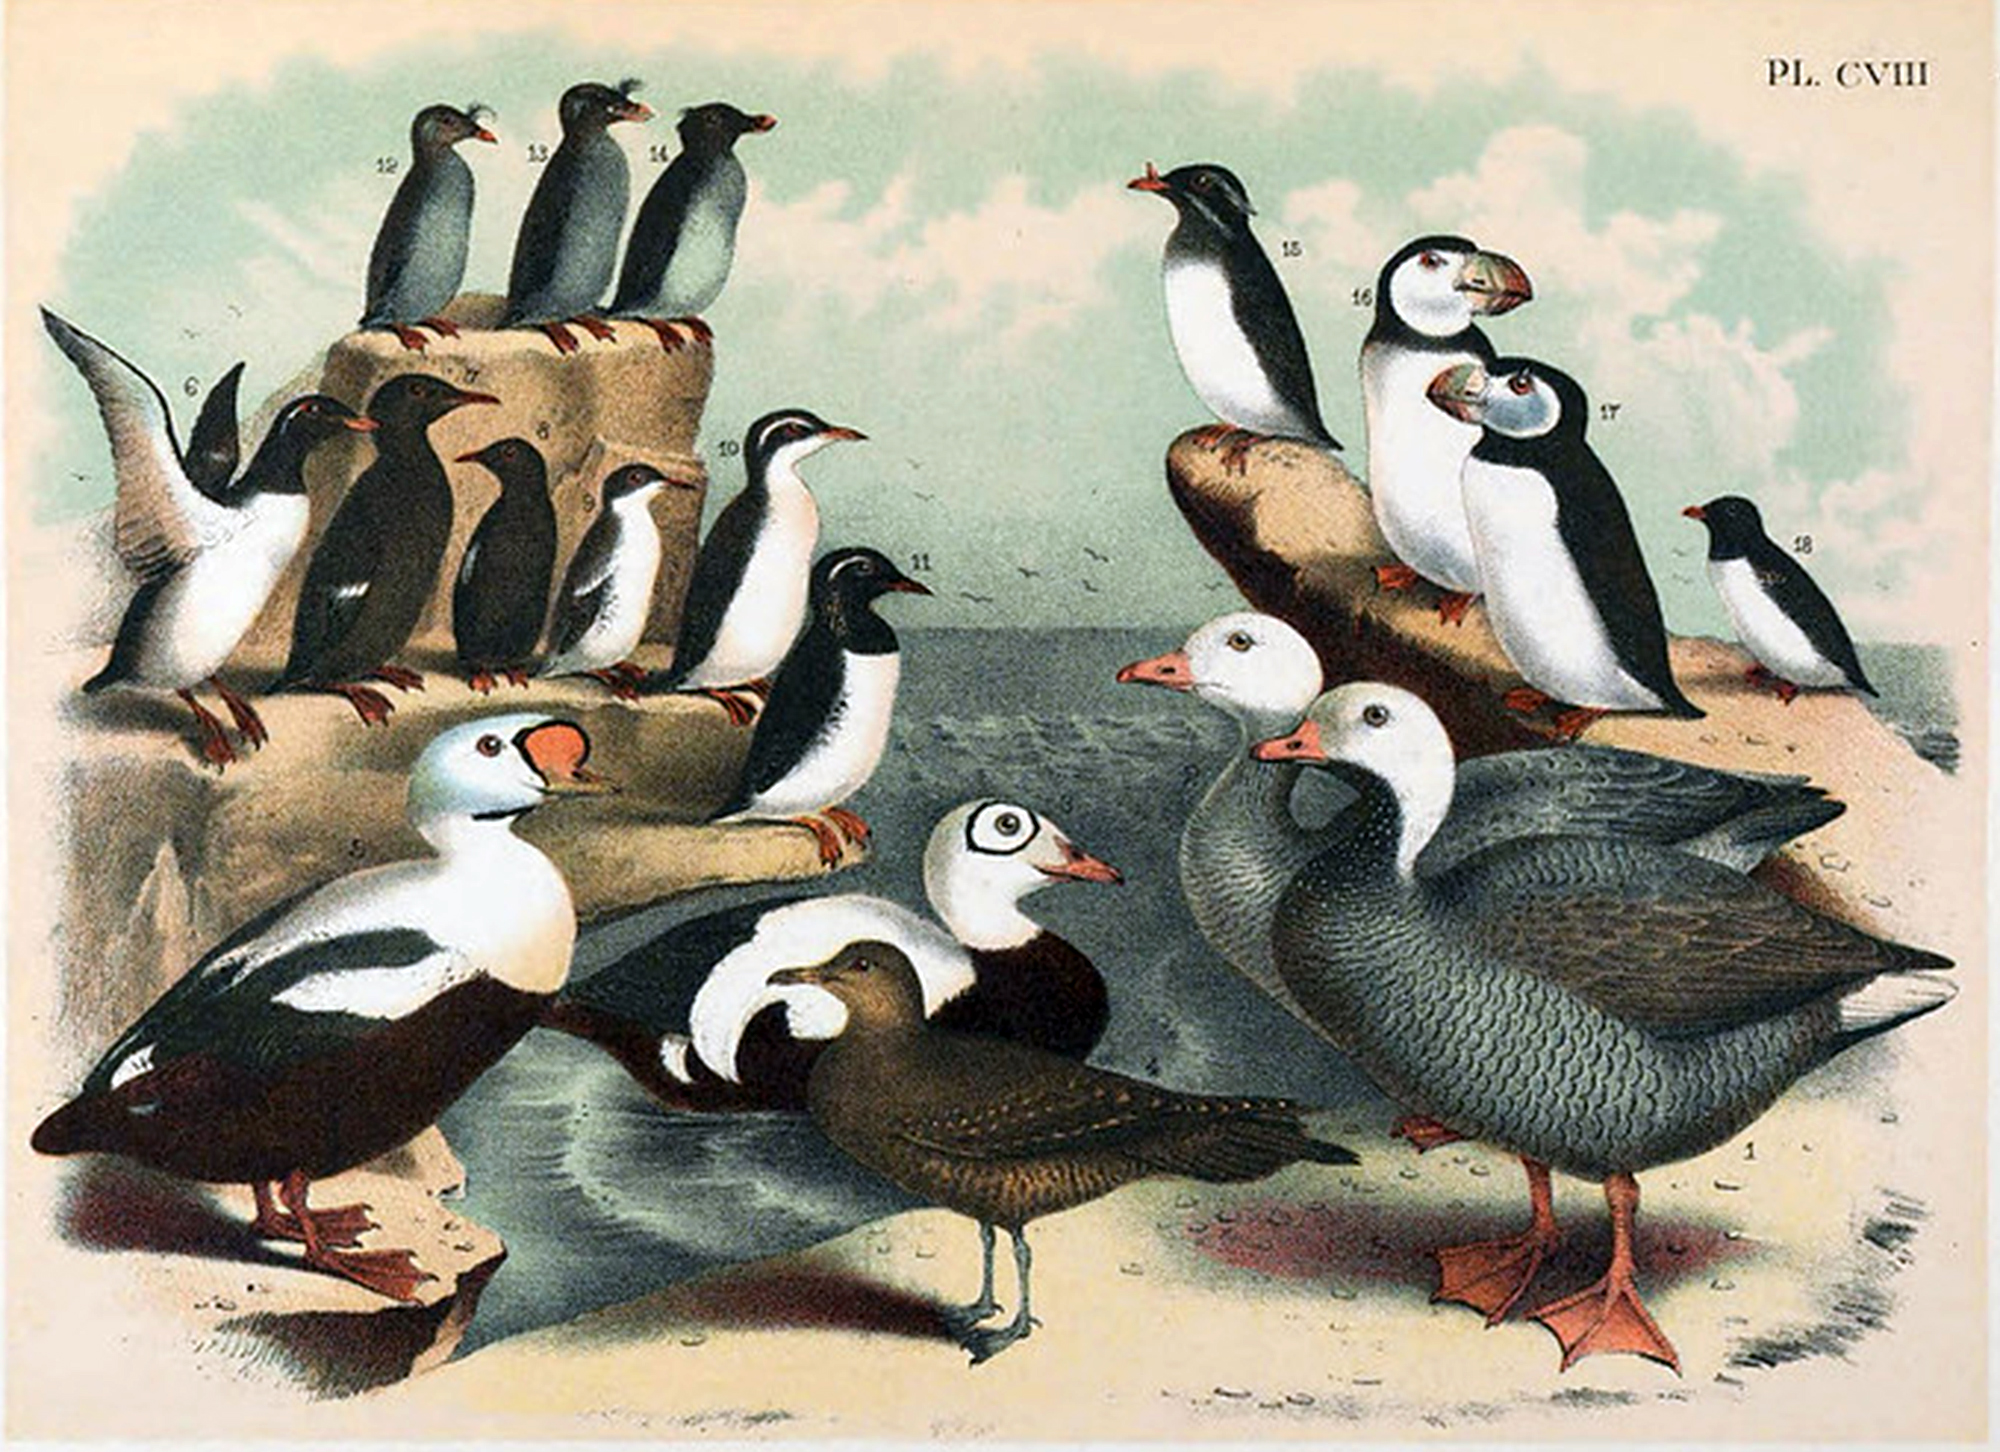
Vintage plate of some of the bird species we were studying, including the ancient murrelet (11) and rhinoceros auklet (15). Image courtesy the BHL Flickr page.
The data were primarily GPS and GLS tracks and were housed on Movebank (e.g., like these rhinoceos auklet tracks). Co-author Allison Patterson (who is brilliant, by the way) and I decided to develop an R package and create a standardized workflow to translate Movebank data to PDF reports and maps. And thus OPPTools was born.
The workflow
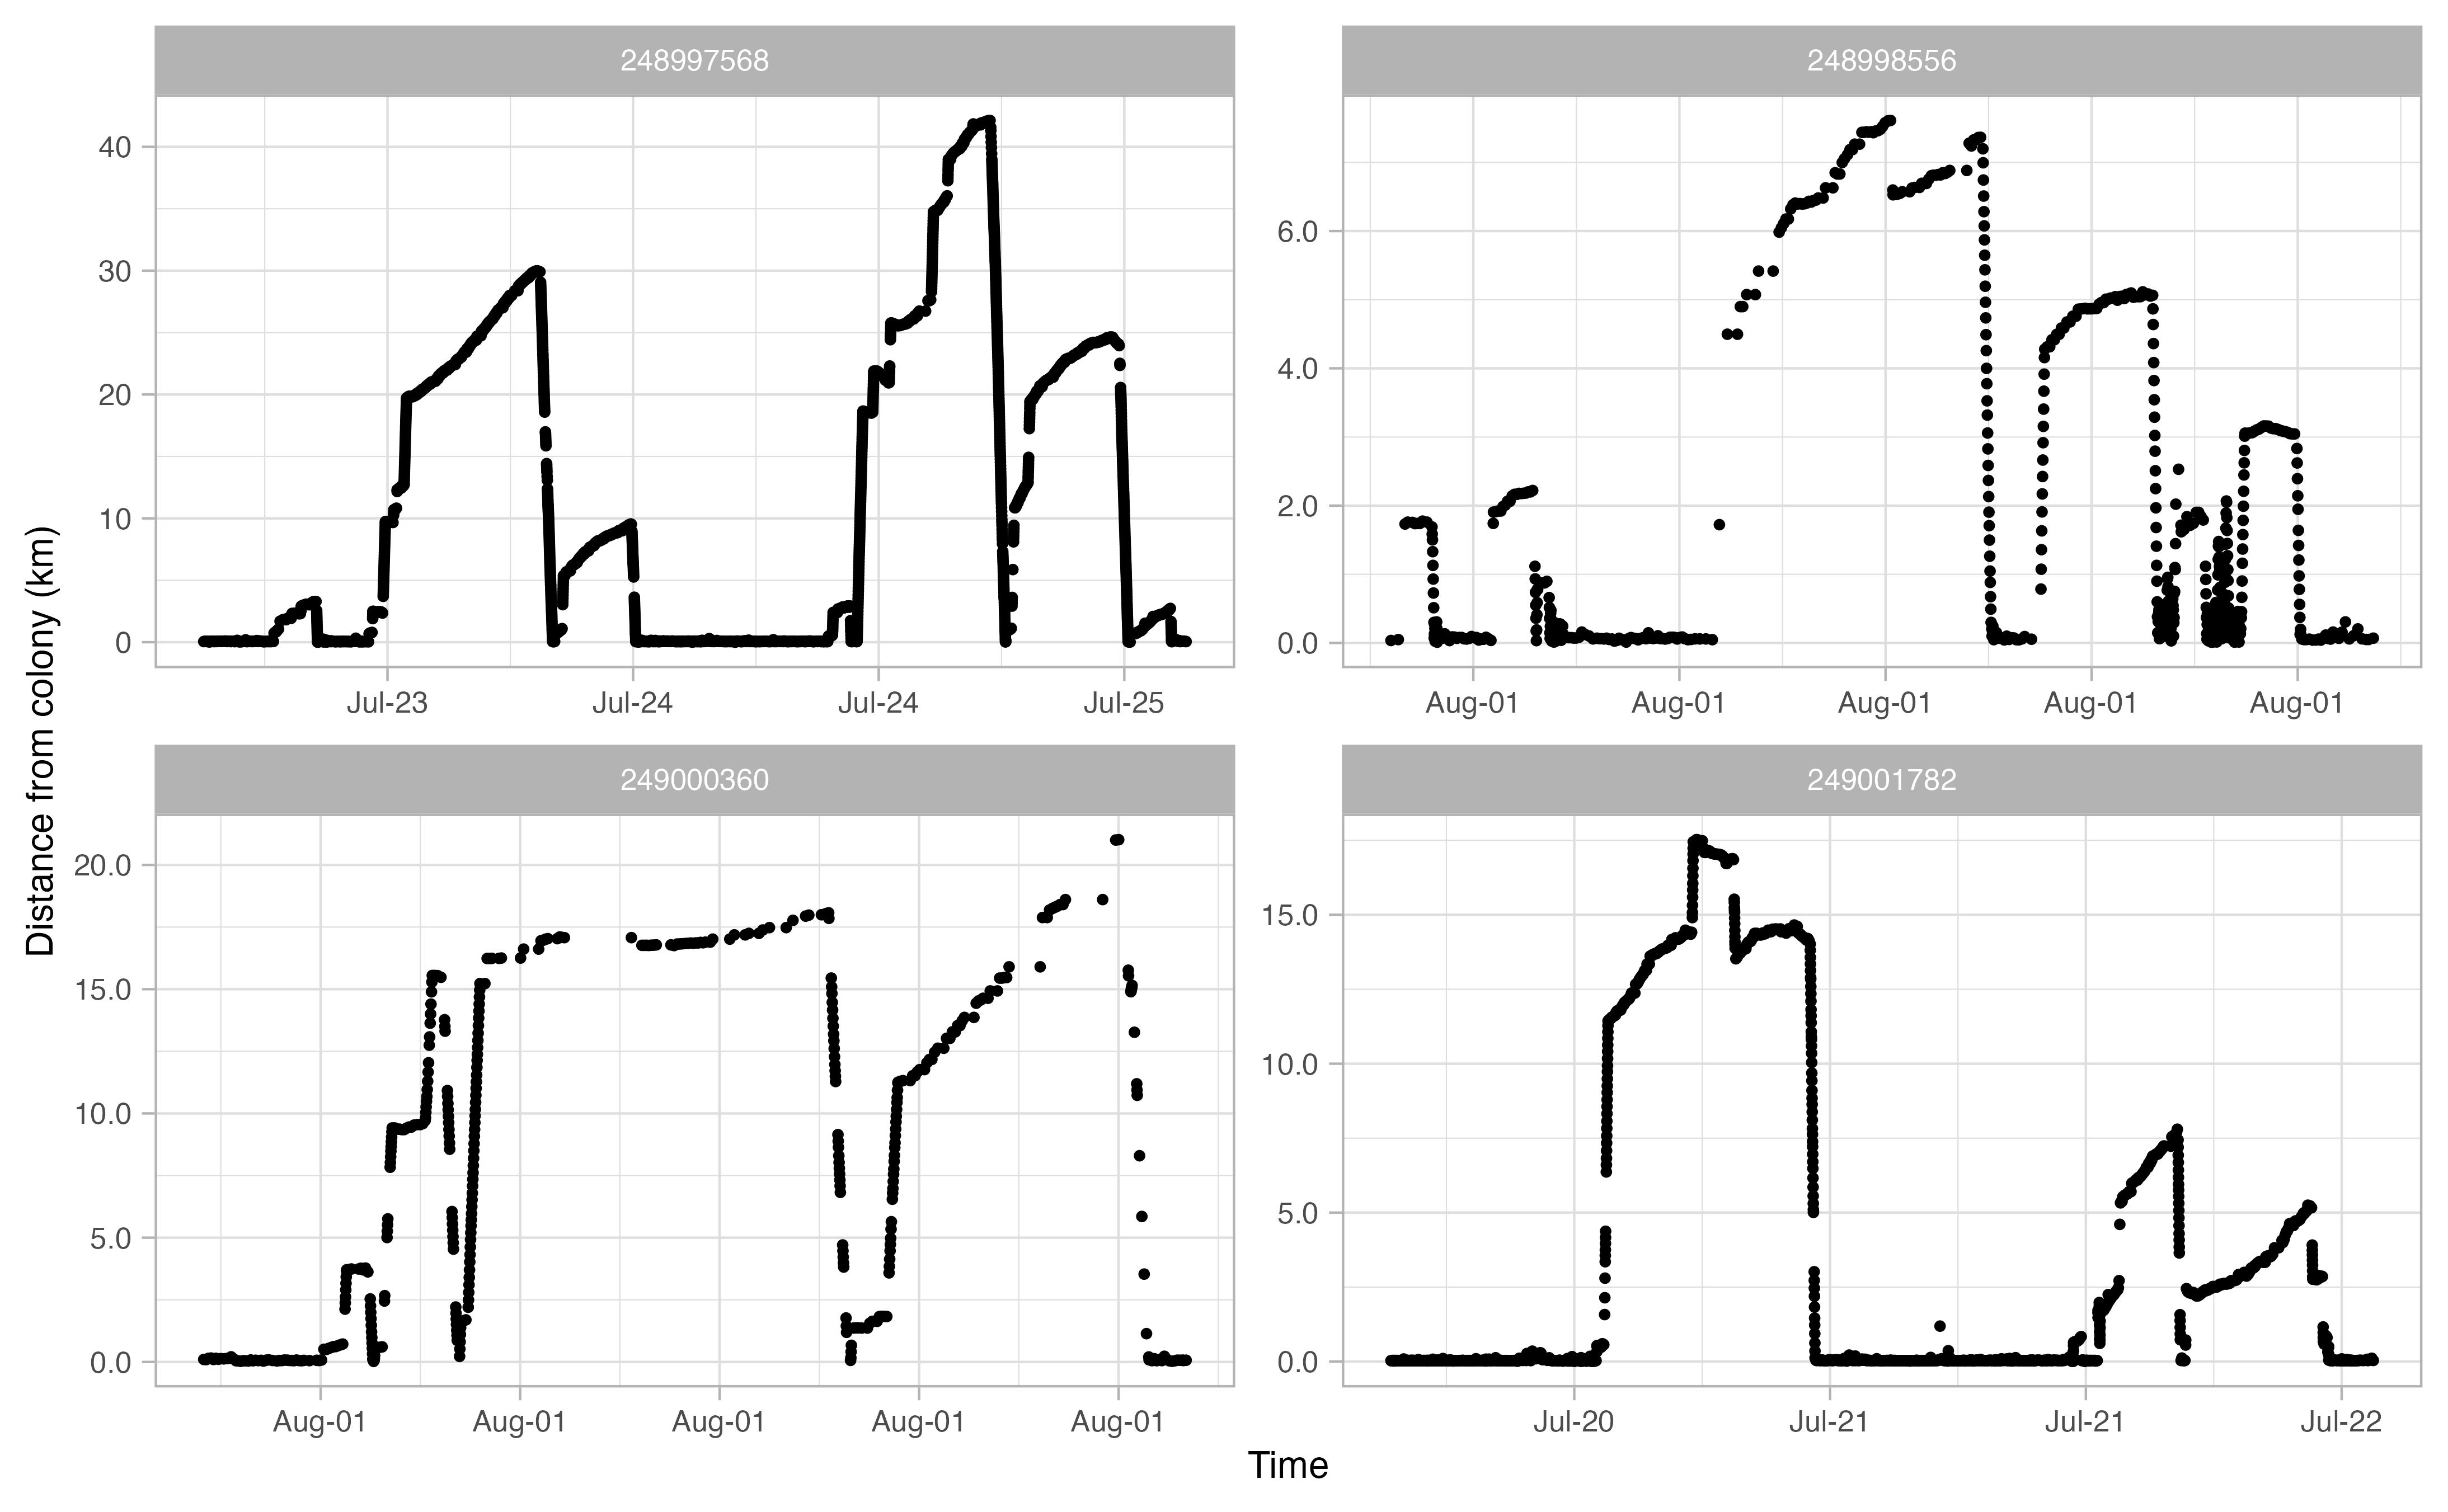
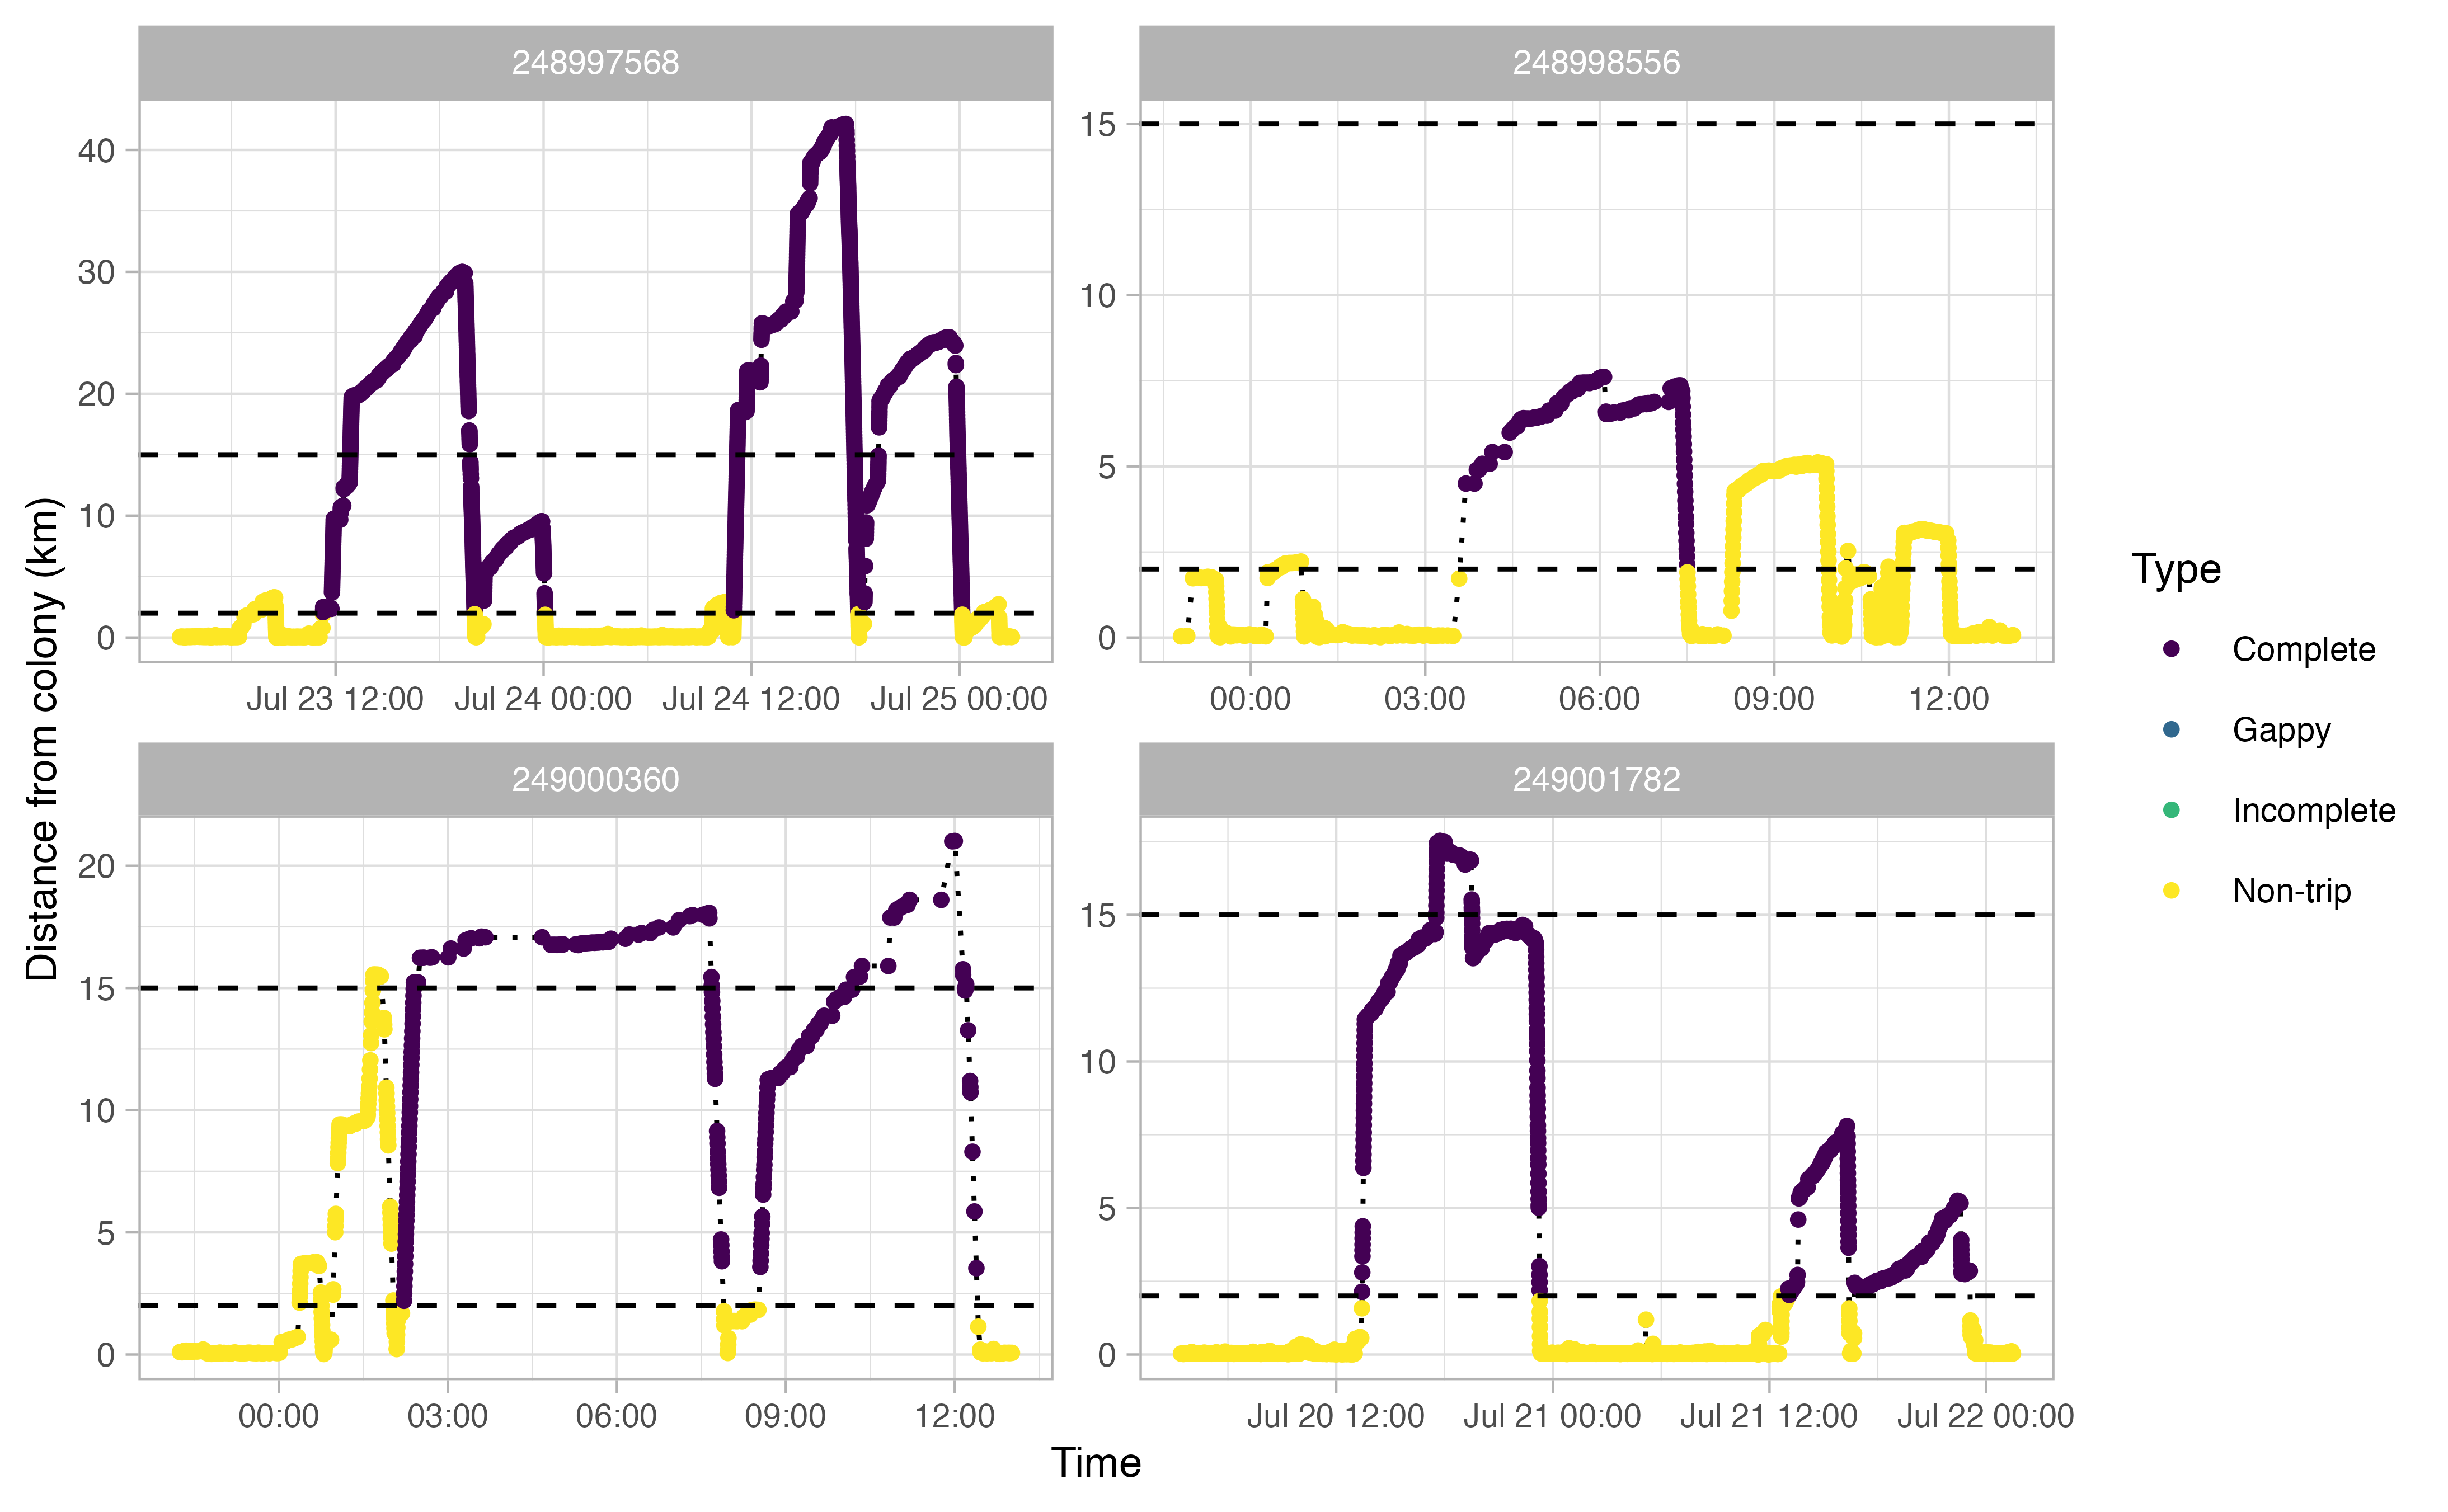
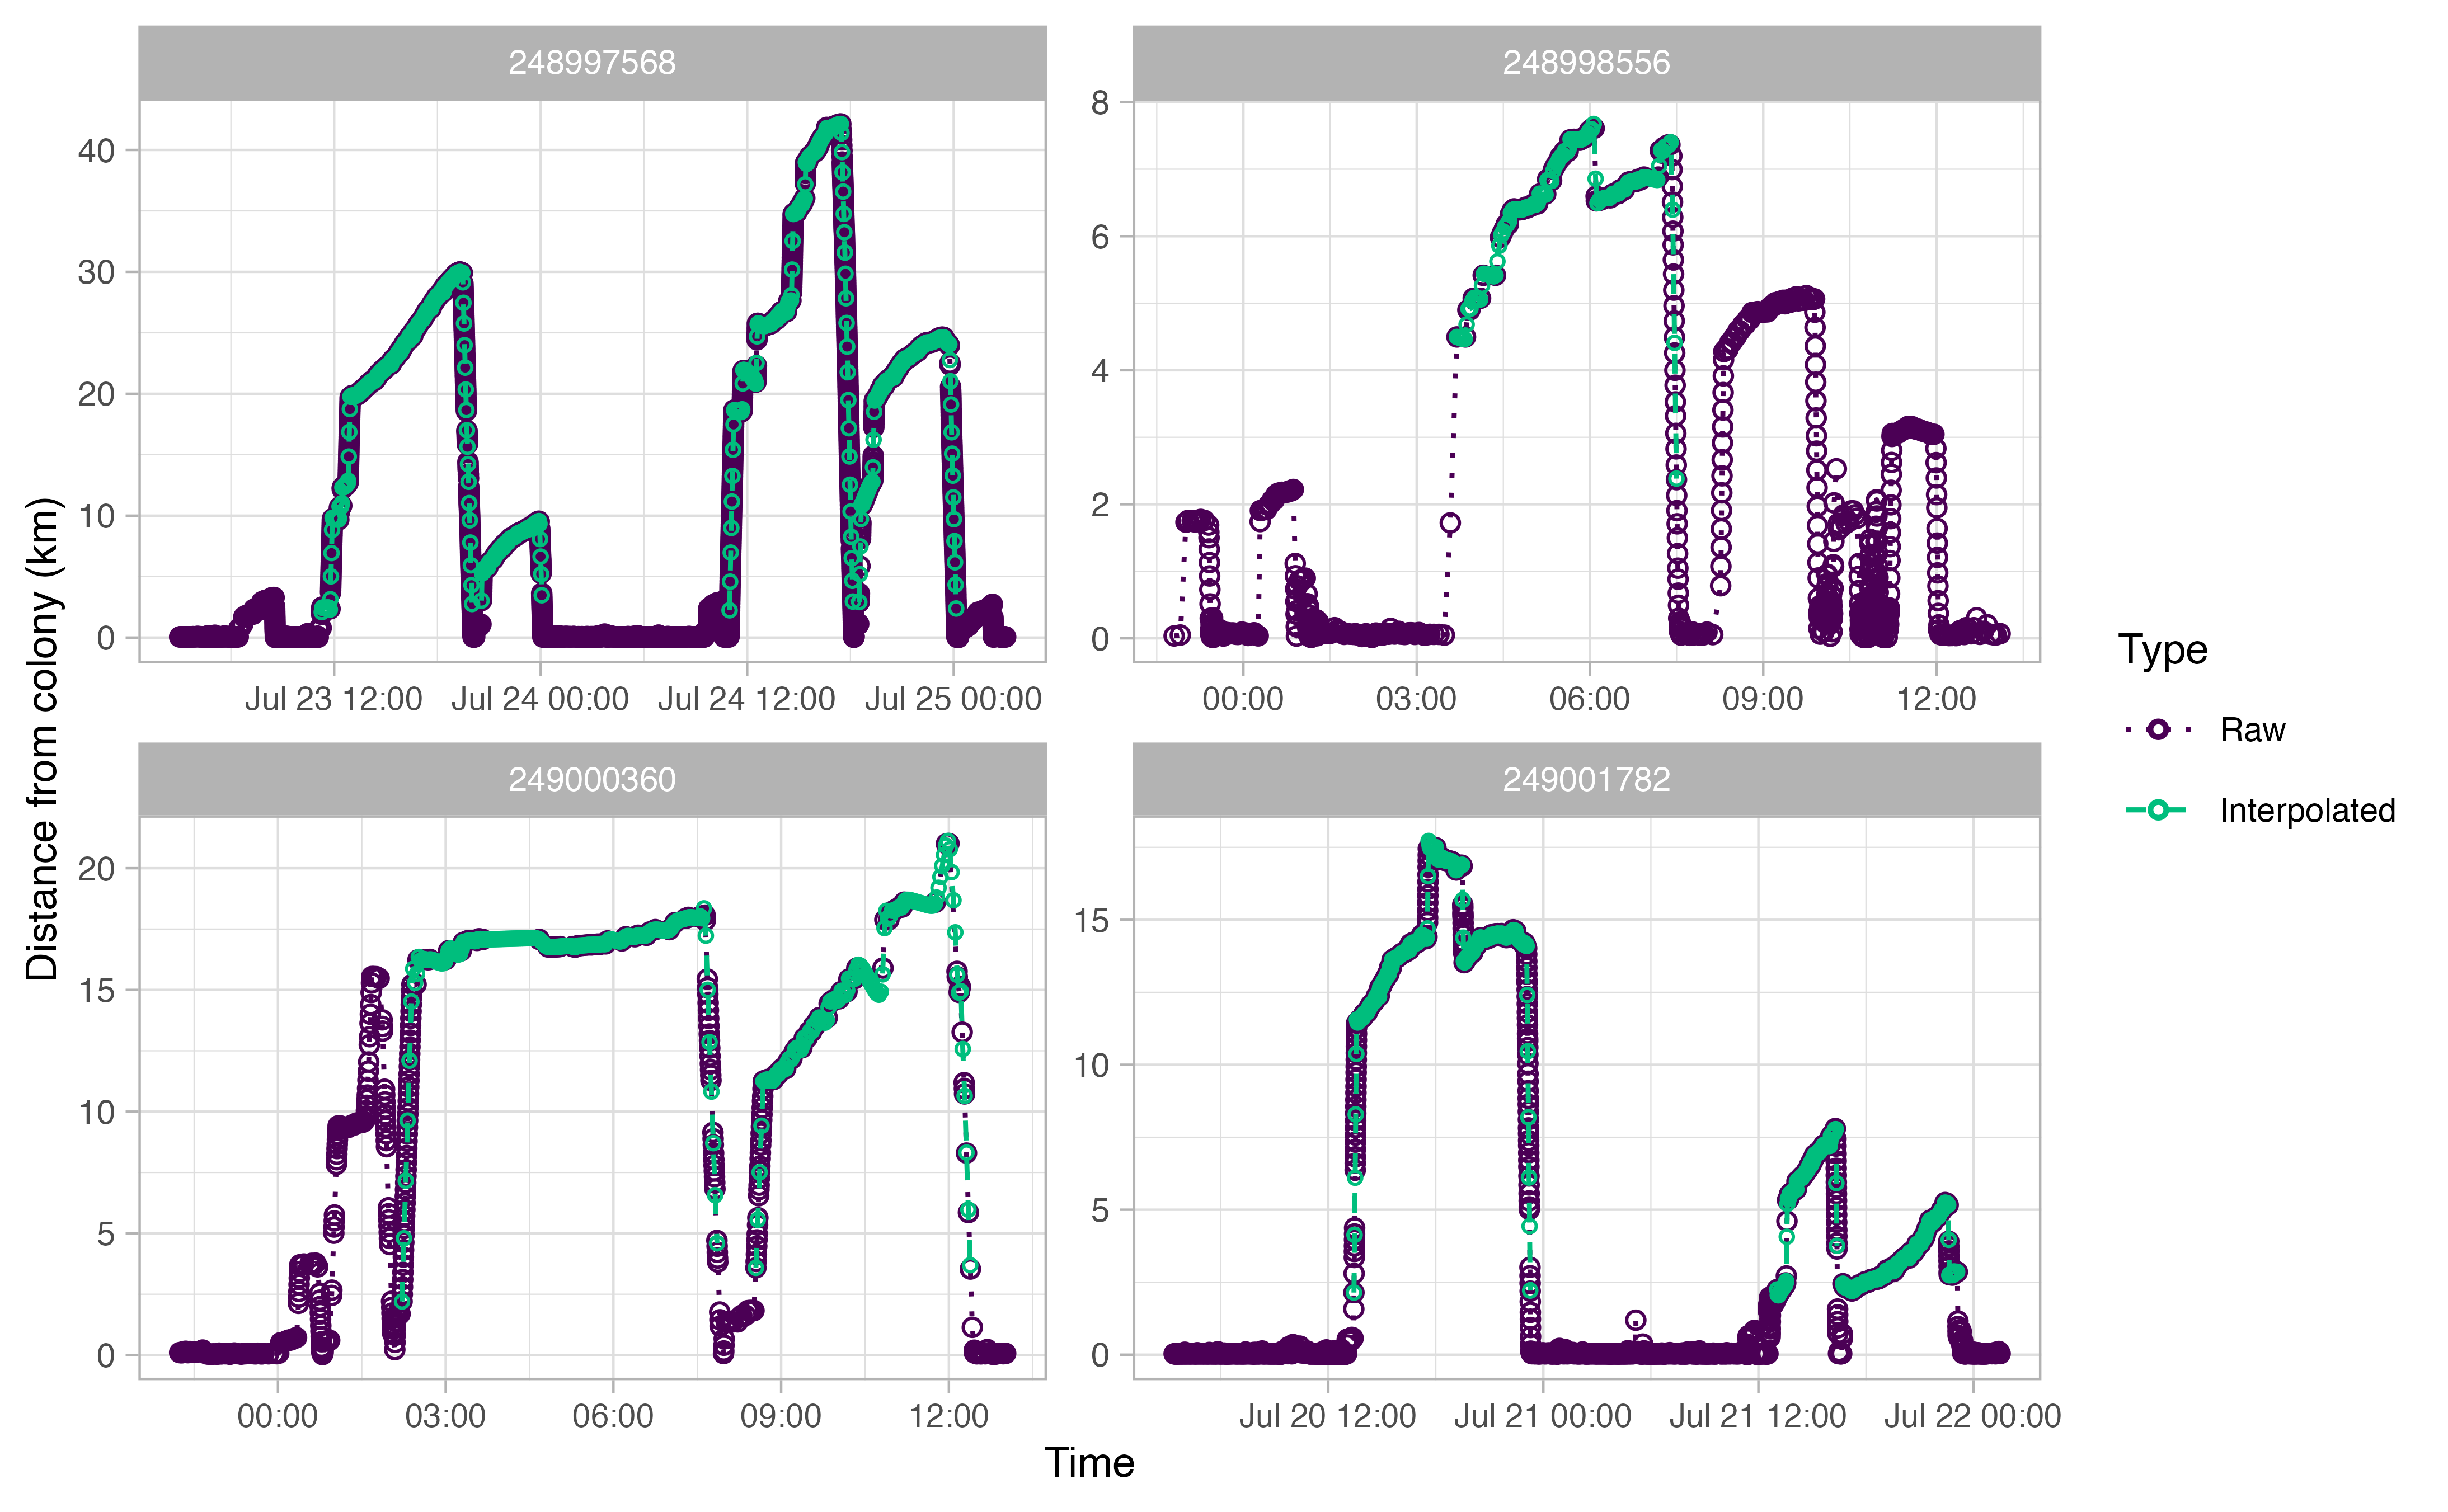
The actual analysis method draws largely from a paper by Beal et al. (2021), which outlines steps to derive “Key Biological Areas” (KBAs) from movement data. The workflow can be summarized as follows: first, GPS tracks are downloaded from Movebank and cleaned up to remove unwanted artifacts; then the tracks for each individual bird are explored in order to delineate individual trips away from the colony. Once trips are extracted from the tracks, any gaps are interpolated with an ecologically informed crawl function. Specific parameters in our various functions were all informed by the life history traits of each individual sea bird species. For example, in the figures below, we determined from the literature and Allison’s deep knowledge of thick billed murre ecology that a murre on average makes trips away from the colony that are between 2 and 15 km distance and a minimum of two hours long.
The end result
From there, we estimated animal space use with the various methods popular in ecology today: I created a series of data products exploring kernel density estimation, Brownian Bridge movement models, and autocorrelated kernel density estimation methods on our seabird data, and we chose the most biological appropriate models for each species from there. These kernels/movement models are finally used to estimate our Key Biological Areas for each species. (For a detailed explanation of the whole KBA pipeline, I highly recommend the Beal et al. [2021] paper.) It’s these KBA shapefiles that ultimately went to the OPP oil spill response team, where hopefully they never actually have to be used in the case of an emergency!
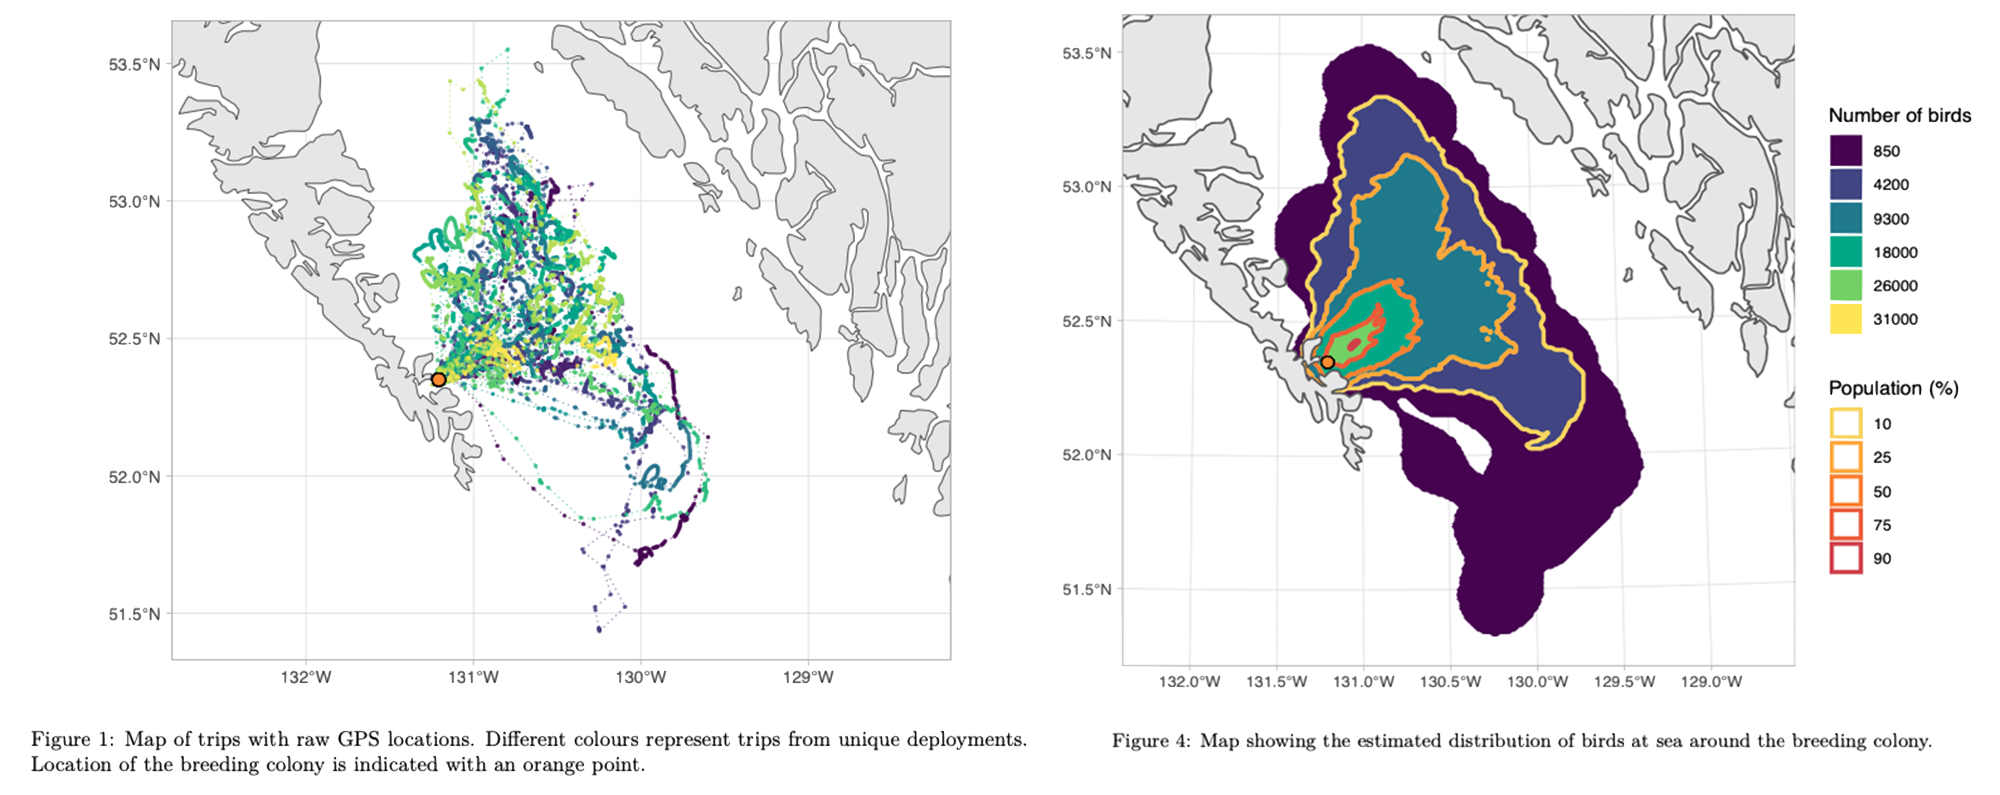
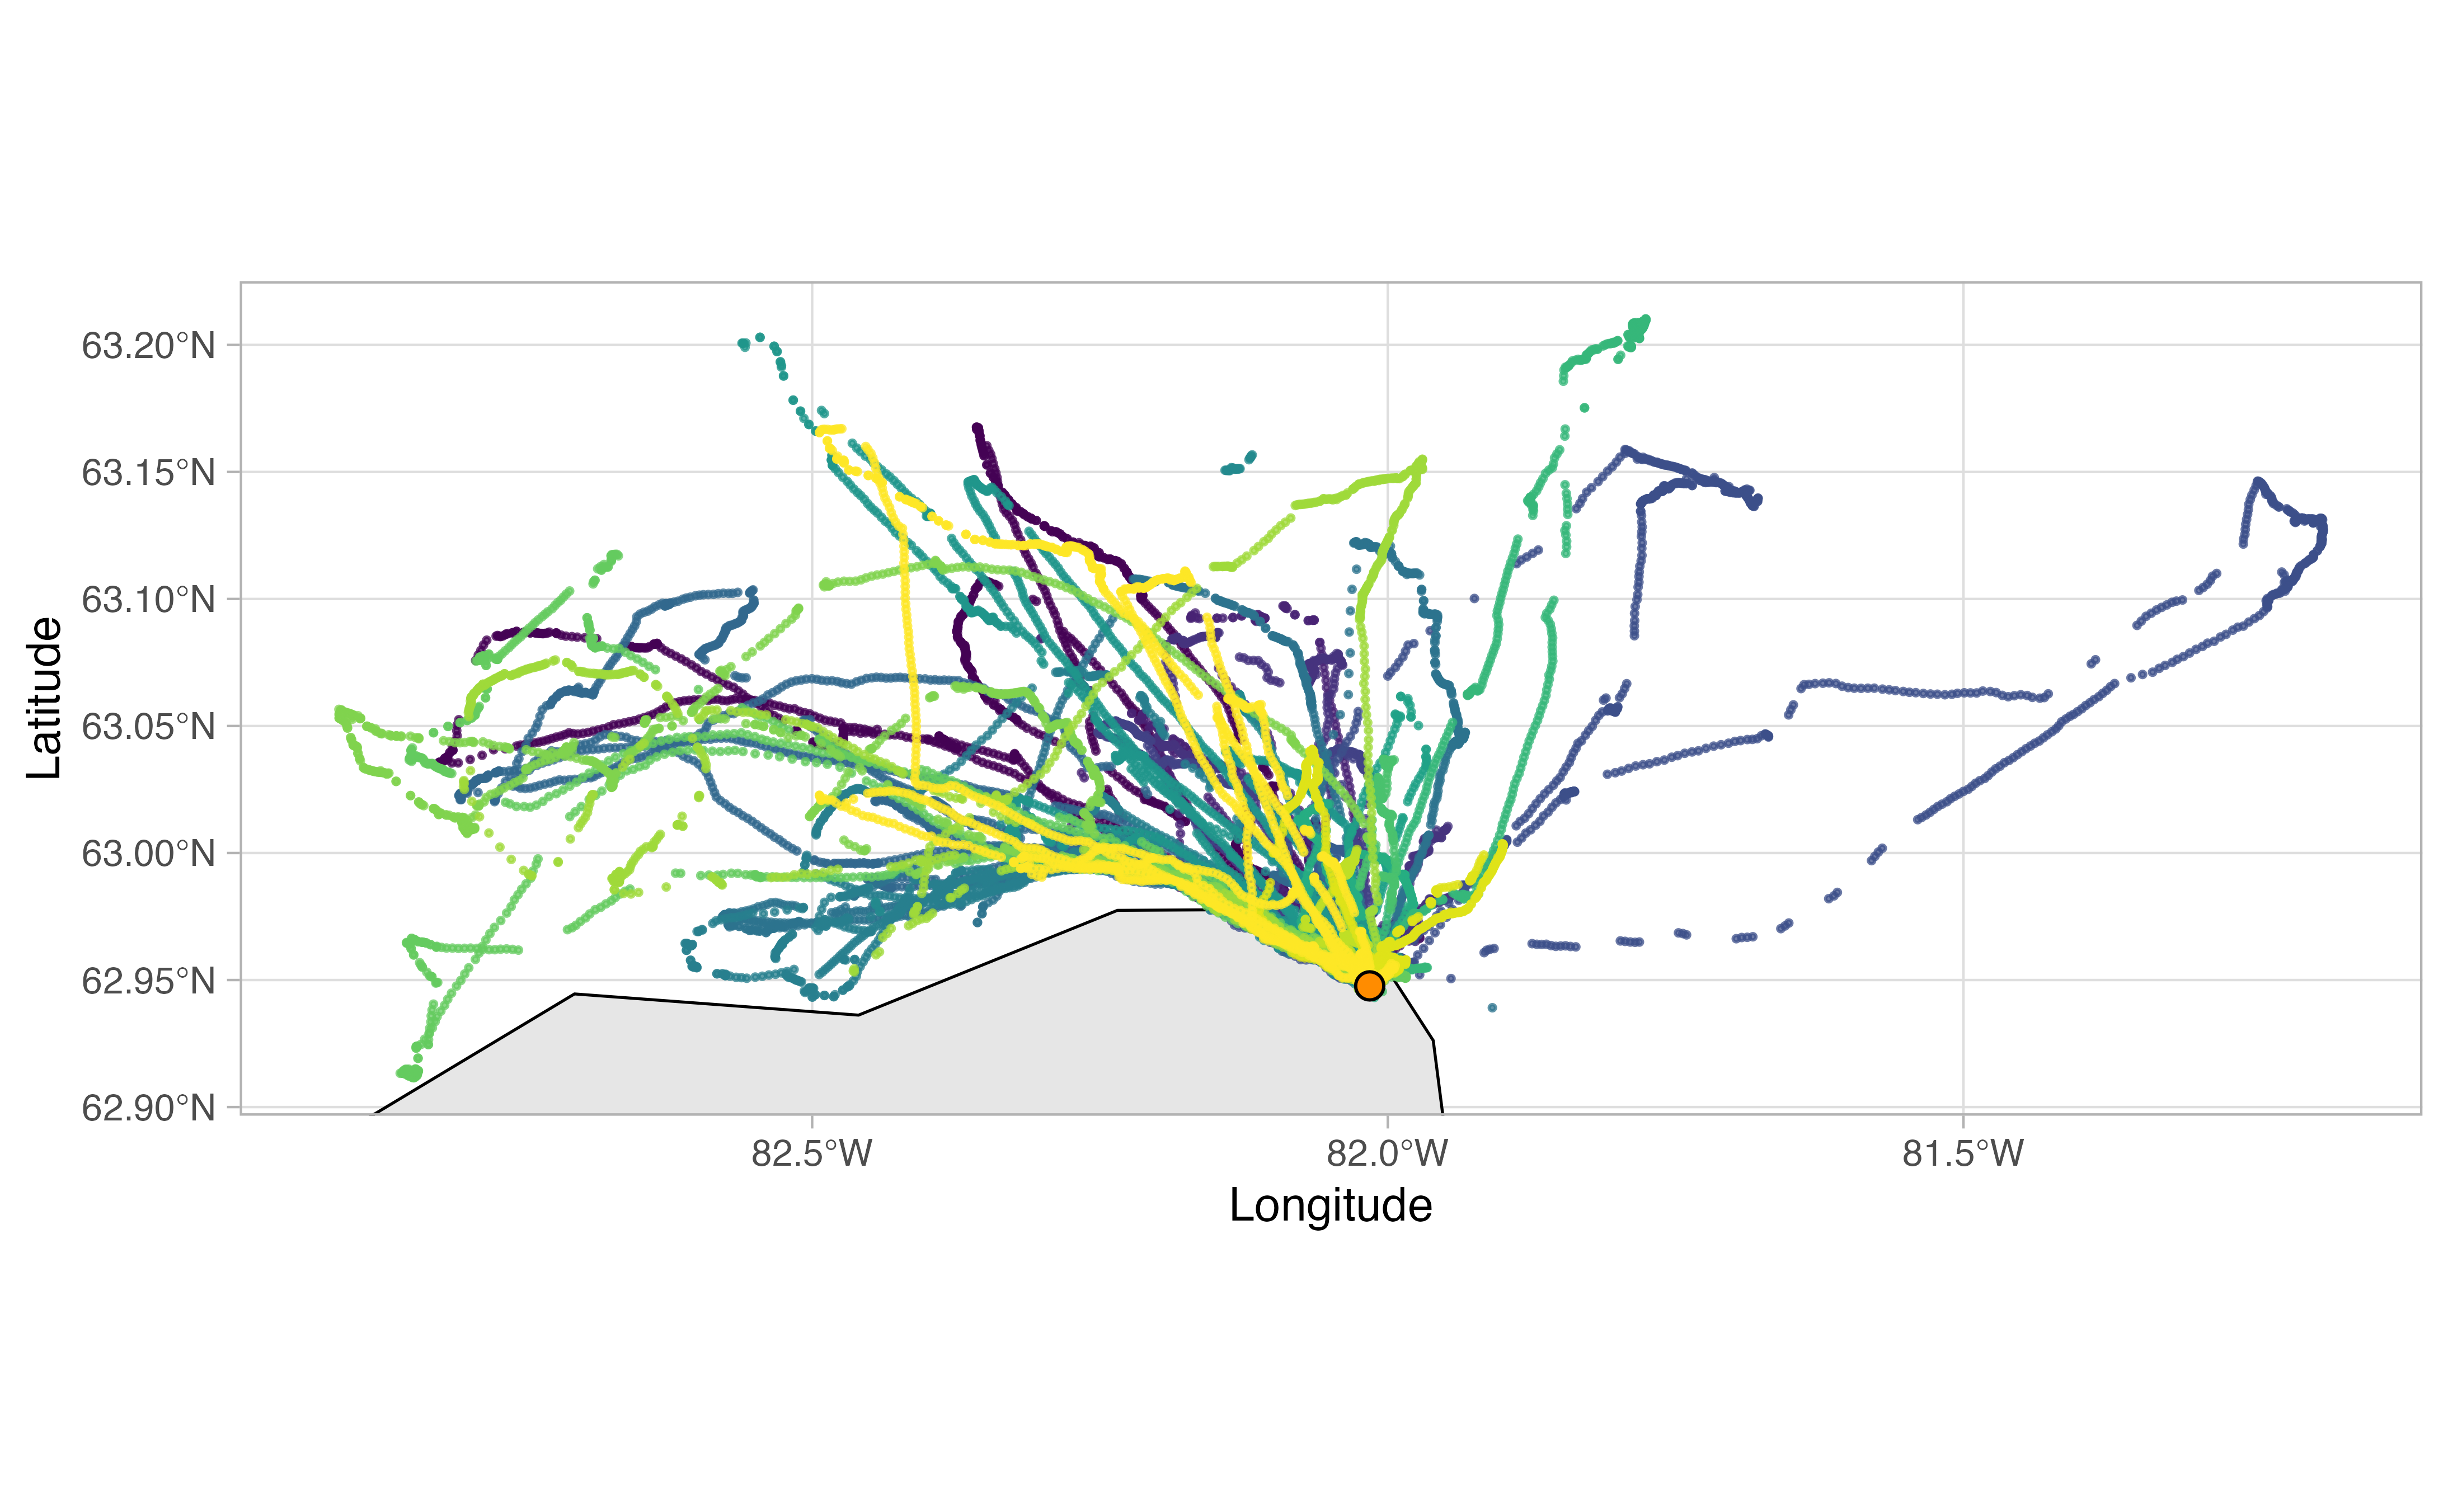
Example of the initial data (Figure 1) and the final data product (Figure 4). The shapefiles from Figure 4 ultimately went to the OPP oil spill response team. Example figures taken from one of the final OPP reports.
Some specific features which I implemented included programming a secure means of storing your Movebank credentials into your local keychain, writing functions for calculating kernels/Brownian Bridge movement models, documenting the steps into the workflow vignette and pkgdown website, and creating the code that actually generates and saves the final OPP KBA shapefile outputs.
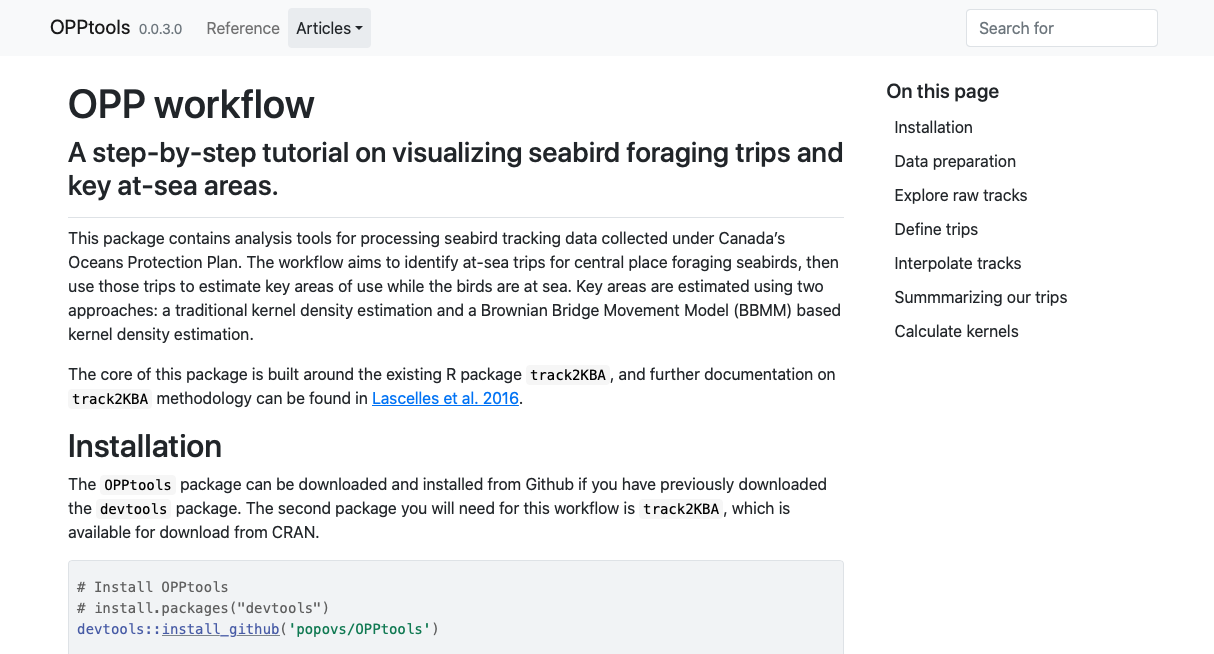
Screenshot of the OPPTools documentation.
All in all, it was wonderful to see something as abstract as GPS points on a map be translated into a meaningful data product with direct conservation applications. More of this please!
References
Beal, M., Oppel, S., Handley, J., Pearmain, E. J., Morera- Pujol, V., Carneiro, A. P. B., Davies, T. E., Phillips, R. A., Taylor, P. R., Miller, M. G. R., Franco, A. M. A., Catry, I., Patrício, A. R., Regalla, A., Staniland, I., Boyd, C., Catry, P., & Dias, M. P. (2021). track2KBA: An R package for identifying important sites for biodiversity from tracking data. Methods in Ecology and Evolution, 12, 2372– 2378. https://doi.org/10.1111/2041-210X.13713